01 / Collect
Connect to any equipment.
SCADA systems, controllers, meters, generators, switchgear, compressors, batteries, PLCs, HMIs, APIs, databases, scripts, all unified into a single source of truth your team can dashboard, alert on, or query.
ControlCom Connect collects from anything you already own, turns it into clear views and automated reports, and alerts the right person before things break.
SCADA systems, controllers, meters, generators, switchgear, compressors, batteries, PLCs, HMIs, APIs, databases, scripts, all unified into a single source of truth your team can dashboard, alert on, or query.
Drag-and-drop builder with 50+ pre-built widgets, live data refresh, and multi-site comparison. Build views for operators, executives, and engineers from the same source of truth.
Multi-channel notifications via SMS, email, mobile push, and Slack. Intelligent thresholds cut alert noise. Automated escalation makes sure nothing slips through the night shift.
From live dashboards to AI you can talk to, the tools your team needs to monitor, understand, and act on everything you run.
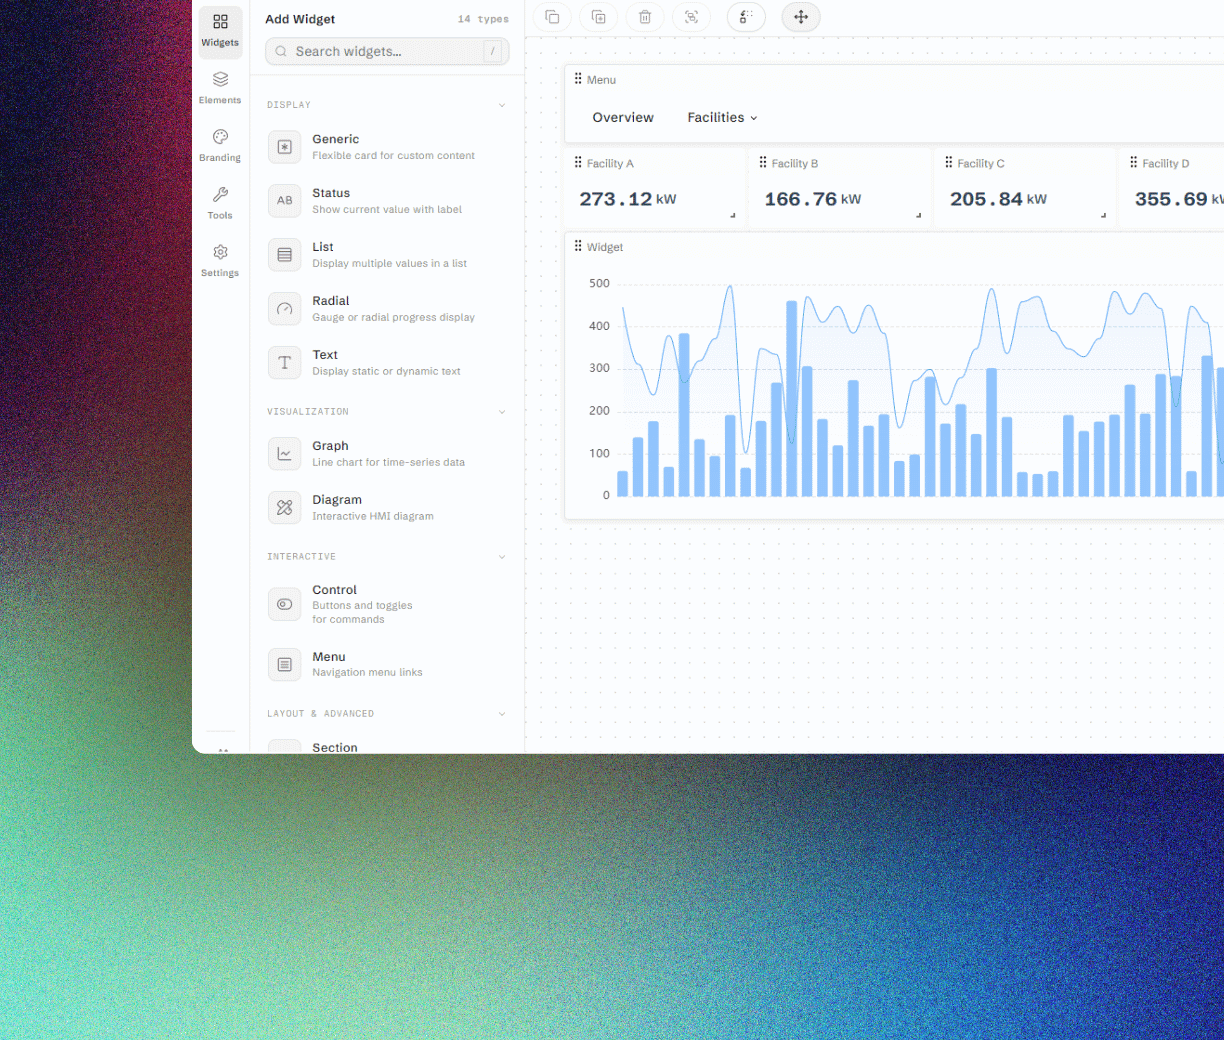
Drag-and-drop builder, 50+ widgets, and data that refreshes by the second, with views for operators, engineers, and execs from one source of truth.
Ask your facility a question in plain language. Grounded in your assets, variables, and live readings, with the data behind every answer.
Group-based alerts with on-call routing across SMS, email, voice, and Slack, deduplicated so the right person hears it once.
SCADA-style diagrams that mirror your facility, with animated status tied to live telemetry.
Every site and asset on one live portfolio map, with weather overlays and geo-drawn boundaries.
MQTT, OPC UA, Modbus, BACnet, and more, with native drivers plus an extensible Edge Server.
Whether it's down the hall or across the country, ControlCom Connect collects from any equipment you already own and routes that signal into dashboards, reports, alerts, and analytics, all in a single dashboard.
Build interactive dashboards that provide instant visibility into your operations. Drag, drop, and drill in without waiting weeks for custom code.
Group alarms by site, asset, or severity. Subscribe people and channels. ControlCom verifies coverage continuously and flags uncovered groups before the next event proves it.
Professional SCADA-style diagrams with an intuitive builder. Live system monitoring with animated status indicators, custom layouts that match what you actually have.
Visibility is table stakes. The features that get teams out of their seats, and back into them only when something actually needs a human, are the ones that separate a 2025 platform from a 2010 one.
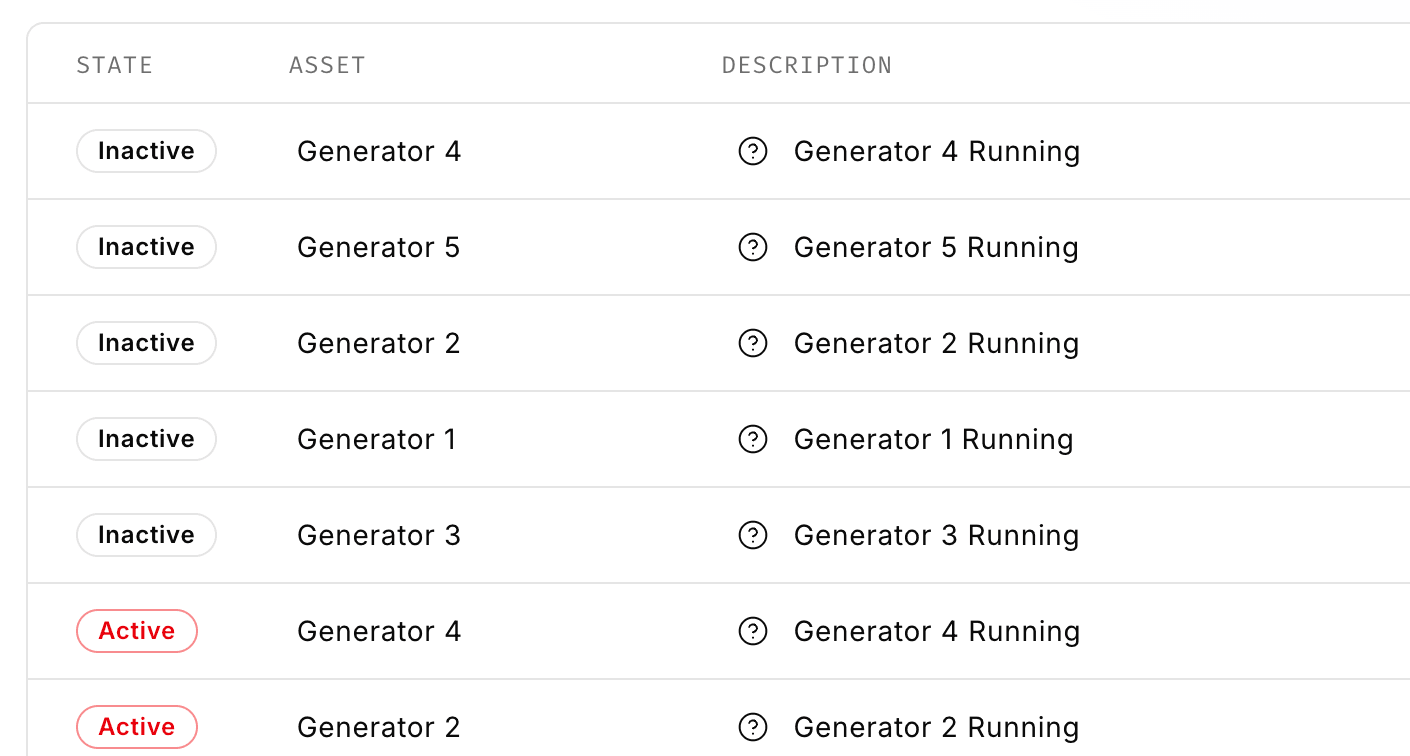
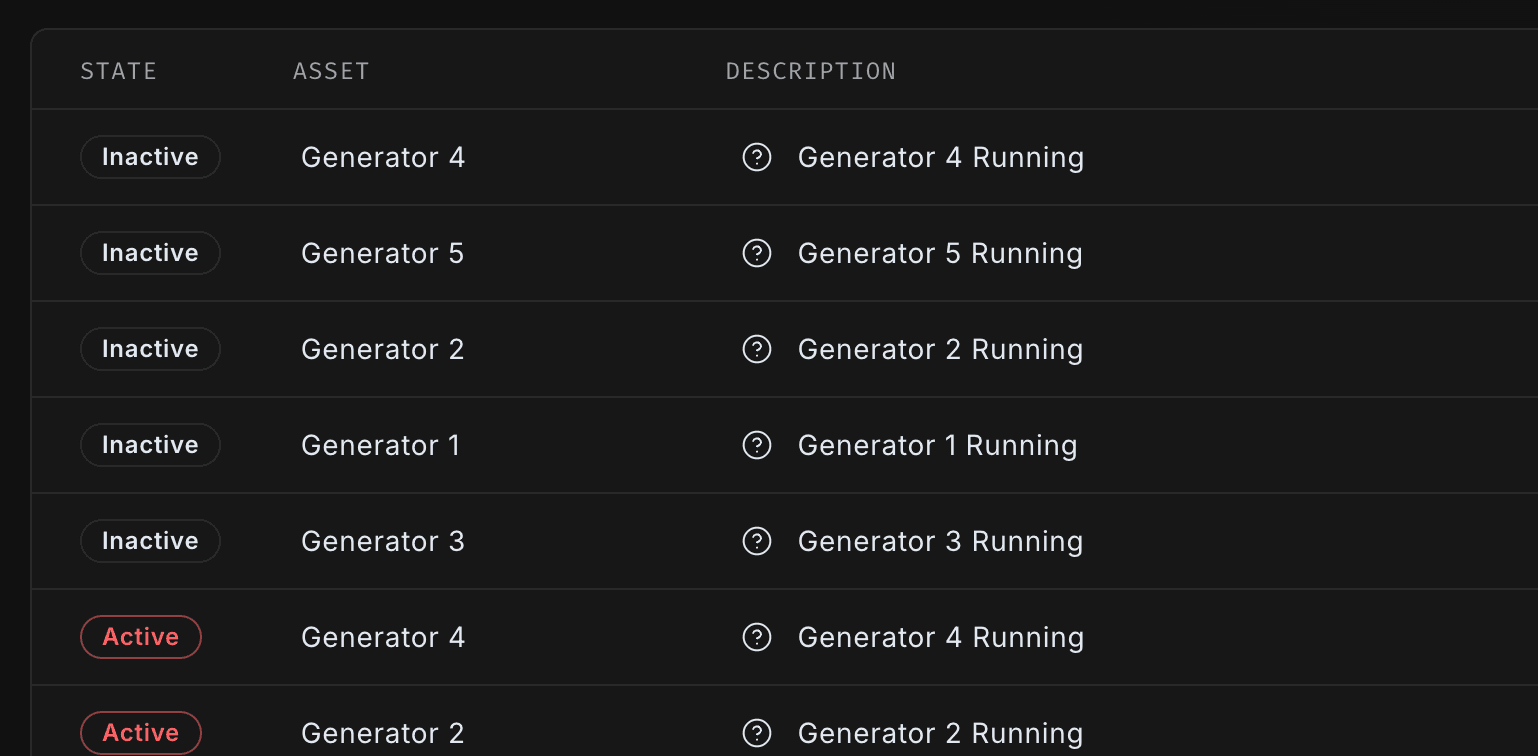
Group-based configurations, per-user subscriptions, and intelligent thresholds that cut noise instead of multiplying it. Recurring-issue tracking surfaces the alarms that keep coming back so teams fix root causes, not symptoms.
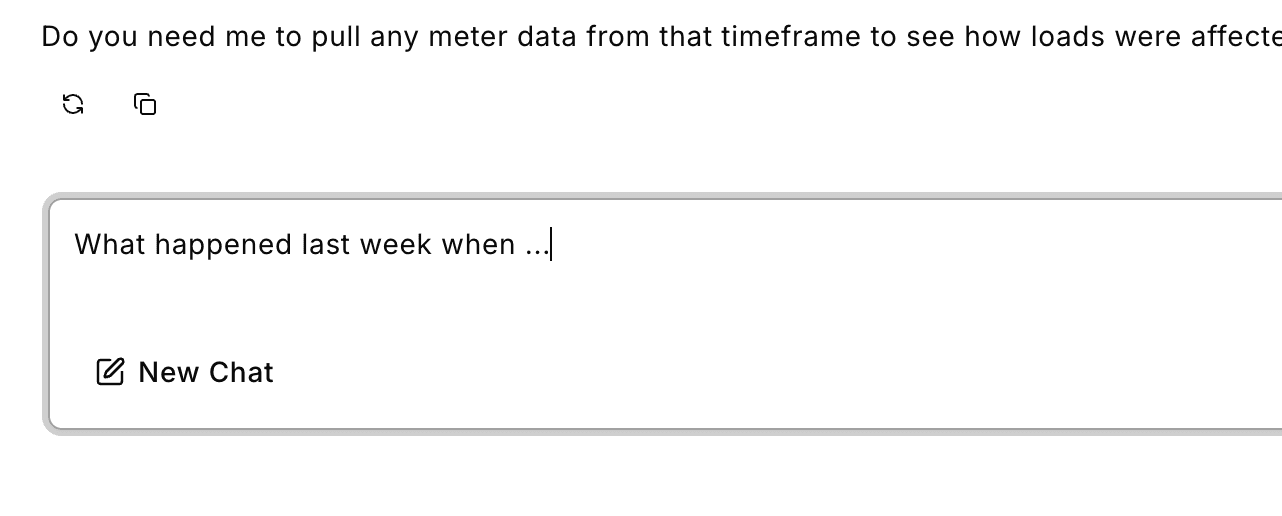
Conversational AI grounded in your organization context, your variables, and your live readings. No prompt engineering, no data export. Just answers, with the data behind them. A model router picks the right LLM tier per query.
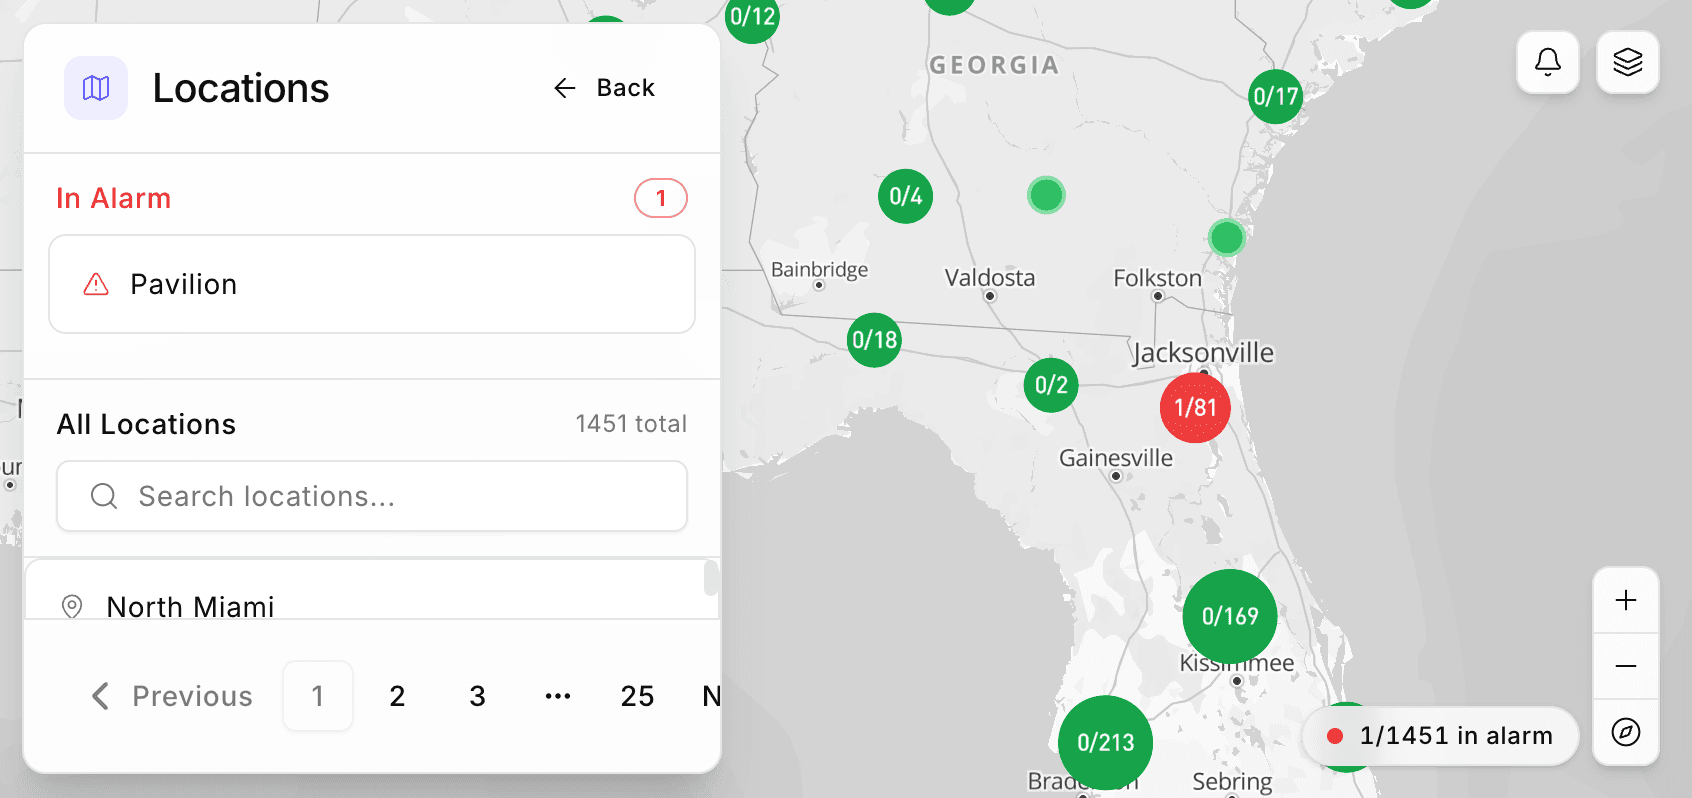
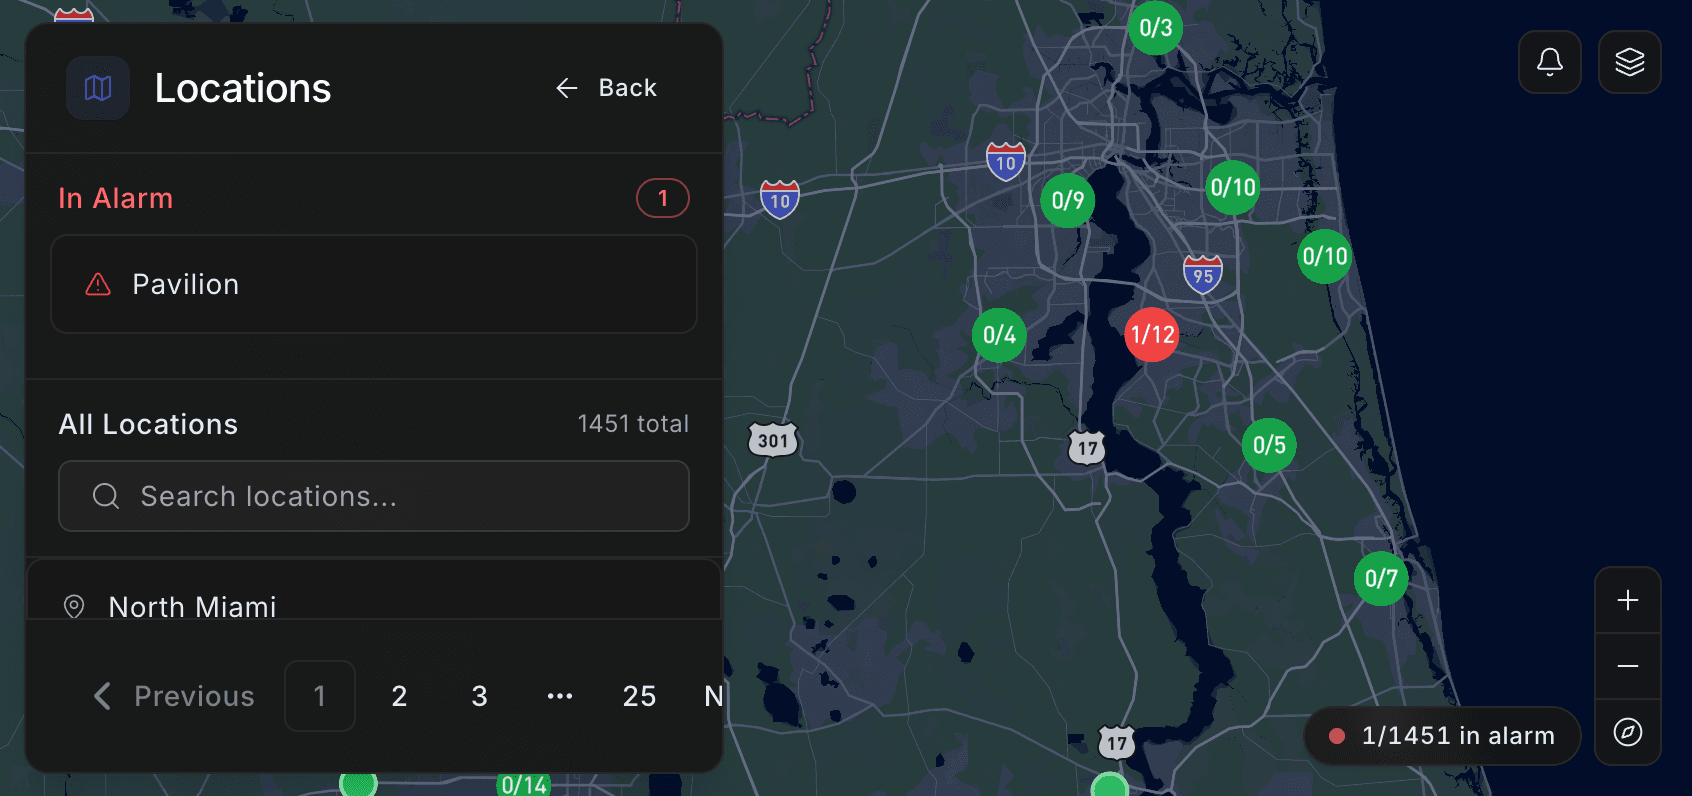
A live portfolio map with weather overlays, location pins, and asset slide-outs. Geo-drawn site boundaries make multi-location operations look organized instead of overwhelming.
Most teams never need to write code. Native drivers, cloud connectors, and an extensible Edge Server, all running on a containerized runtime that fits in 100MB. New protocol on the procurement list? Wrap it in a weekend on the Edge Server.
Automated utility monitoring caught billing errors that would have gone unnoticed: over $160,000 identified on a single healthcare facility deployment, and an instant energy study a hospital used to skip months of consulting.
See how ControlCom Connect delivers measurable results for facilities like yours, in a 30-minute demo with engineers who've wired the panel, written the driver, and shipped the dashboard.
Still evaluating?See how ControlCom Connect compares to other IoT platforms.
Teams across the industrial and developer communities are taking notice. Here is where ControlCom Connect has been featured.

